Technical Analysis – Twitter Feed

Seems a twitter is probably the right way to handle day to day activity. Markets are heating up so for those that like to be active and want to follow trades on a daily basis please follow the link.

https://twitter.com/Capitalsynthes1?s=09

Ill develop a few themes there in real time. One for the moment is the carry fx unwind. The two great carry trade currencies have been the euro and the jpy. The euro has eclipsed the jpy over the last five years as the world’s risk on funding currency, mainly flowing into USD risk. The key to supporting this one way trade has been 1) the over night yield spread between the US$ and the Euro.  2) The strength of the US risk on rally.

If these two issues reverse the carry trade unwind would produce an unimaginable tilde wave of euro debt repudiation. With growth weak and deficits high in the US system the corona out break could well prove the straw that breaks the euro carry US$ risk on trade.

More liquidity and more negative rates are unlikely to help the risk on trade given the likely sharp downward earnings implications of the emerging pandemic. More liquidity from central banks and policy makers may more likely create stagflation and a bubble in safe heaven assets like gold.

Volatility on the eurusd paid is at historic lows of 5% p.a. at present.

The over night spread between the usd and euro is 200 basis points.

The next fed scheduled meeting is 3 weeks time. If markets move it is possible a fed meeting is held earlier.

Kindest regards

Rich

Technical Analysis – “SP500 Tactical Top Confirmed” – 28th Jan20

Guys, i post below a quick tactical update here given the step change in volatility from the recent market movements.

US Risk

SP500 and Technology have both over shot and reached record overbought territory on their weekly and daily
time frames. With sentiment at contrarian levels and the SP500 reaching 3350, risk markets have moved to a late January tactical top formation for a likely 4% to 5% retrace into initially early February and later into Q1 before risk resuming its bull trend into summer.

Friday’s reversal in risk mkts effectively means risk topped on January 22nd with short signals in fading momentum and significant price reversals in Russell2000 & cyclical key sectors provided the confirmation that a 2-month cycle peak is likely in place.  3212 in the SP500 cash and where the Nasdaq100 should sell-off towards 9035 to worst case 8900. With initial spikes in our fear indicators, and some oversold cyclical sectors (tactical negative surprise in commodities) signals buying territory for selective cyclical sectors. Not yet in technology which needs longer to work off its near term record over bought levels.

Cycles wise, august 2019 represents a major risk bottom where global yields and cyclical sectors based and where we see the USD reversal and Q4 USD sell-off as the move into a new reflation cycle.

Strategically, the December 2018 low was the start of a major wave V bull pattern, where the August low was the base of an impulsive minor wave 3 (of V), which usually marks the momentum/breadth peak of the whole bull cycle. Tactically, minor wave 3 topping in late January for a corrective pullback into later Q1 before the minor wave 5 starts into summer.

We see classic bubble phenomena in technology/quality growth and renewables, which fits the late stages of a major bull market but where without any divergences in momentum and breadth indicators this remains underlying bullish with target 3600 for a major wave V top.
European Markets:

Whereas the US market overshot into first half January, there was deteriorating momentum signs of
distribution again in European risk, where in the Stoxx-600 we saw the breakout to a marginal new all-time high but with the DAX, Euro Stoxx, FTSE MIB and FTSE-100 facing strong price resistances. With last weeks price moves the Euro Stoxx has broken its trading support at 3745 and is testing its tactical support at 3690. A break would open the door towards 3605. On the sector front, pullbacks in cyclicals, in construction, industry, chemicals, basic resource, travel and financials with autos and energy clearly undershooting but where the negative surprises are likely oversold buying opportunity early February.

EM& Commodities

With investor fears spiking on the coronavirus in China there are significant sell-offs in economy sensitive commodities and everything which is China related. The sell-off last week was selectively stronger than expected (copper, crude oil) but so far price moves do not contradict the core case of an intact mini reflation cycle that we expect to get traction into summer and into H1 2021.

Gold

Gold trades in minor wave 5, where as long as we do not see a re-break below $1543, it remains trading bullish and where a break of $1590 would suggest a wave 5 overshooting towards $1624 and best case $1720.
USD

The US$ is bouncing versus high beta fx but with being overbought against Asia/EM and the commodity block the USD as a trading sell into early February. Commodities/China are selling off but where crude oil (lost more than 20% in 3 weeks) is a buying opportunity into early February and where a volatility spike in the China EFT implies the worst is over in China.

US Treasuries

US 10-Year Treasury Yields are heading into key support at 1.56%, where a break would imply a re-test of the late August low but on the back of our initial early February low projection for risk markets yields are likely in a larger basing process and bounce candidates instead of seeing the risk of a major breakdown or undershooting.

A big night tonight for Tech earnings. Lets see.


Rich

The Secular Bull “Final Push” – Year Ahead Technical Analysis 12th Jan 2020 (Part1)

Happy new year to you all,

2019 was a complicated though blisteringly high return year for most market indexes and thankfully my own book of assets. It was a very selective year though with 5 mega cap stocks in the US making much of the index gains.

It was another year where the base cyclical case didn’t play out exactly to plan. Again we needed to nibble and reactive to avoid losses and ensure we rode the gains. The projected C wave washout didn’t occur and instead we leap up to new highs as the secular bull market reversed the weakness and many asset prices soared higher once again. You had to roll with what price was telling us to survive and prosper.

So here we go on to another year. Lets hope its another good one.

Global Equities

Following a near 19 months of sideways trading in global equities and cyclical sectors in a bear market, the distributive top appeared in for global risk in H1 2019. Nonetheless by Q4 2019, with the US market at all-time highs and Europe breaking a 20-year resistances, the final push in global equities had commenced.

Here the 2020 markets projection:
The negation of the 2019 C wave sell off by central bank action, translated into fundamentals, has produced a “wave V” as a mini reflation cycle in a toppish Juglar Cycle in the US, whereas globally it´s just an economic rebound that makes the 2018 bear market a copy of 1998 on the way into a major top and subsequent synchronized Juglar Cycle decline/recession.

Bullish 2020 (presidential election year) but its a high conviction call that this “wave V” will be just a relatively short late cycle bull market lasting minimum into summer 2020 to more likely Q1 2021. In a wave V, we should expect, growing selectivity, deteriorating breadth/index momentum, and rising volatility.

Having said that, after 2019’s record ETF outflows of equities, there could well be selective surprises, where Europe is likely to be the outperformer candidate and where the breakout to a new 20-year high in the STOXX-600 is the trigger of a major squeeze higher.
Tactically, after impressive Q4 rally, markets are very overbought, with the high probability of a risk of a classic tactical washout from an mid January top into a later Q1 (March) bottom as the setup for a strong rally into summer. A potential summer top could be worst case the starting point of a volatile distributive top building process into Q1 2021 in the US, where stock picking and sector rotation should be key instead of chasing the SP500, which we see capped at 3600.

We expect performance to shift more into late cyclical (resource) sectors. We are bearish defensives where we see rising yields as a threat. Relatively our base case is that 2020 performance will be in order:

  1. Japan
  2. Asia/EM
  3. Europe
  4. US (US to strongly under perform in H2)

FX

After being structurally USD bullish since 2011, we have clear evidence that the 2018 wave 5 bull cycle in the DXY had topped. Tactically, after the Q4 2020 USD weakness, we expect a late Q1 USD rebound (versus high beta) as the setup for a wave 3 breakdown into summer and into Q1 2021.

We are bullish AUD, NZD, the Asian/EM block. We are bullish EUR and GBP.

Together with being bearish JPY, we see EURJPY as one of the key performers in 2020.

A USD bear market is the setup for a risk mkt regime shift on the macro side.

Commodities:

2020 is a bullish year for the commodity sector, where the 2011 secular bear market has based. After the 2018/2019 disinflation and subsequent reversal of this via central bank “actions” higher commodities and bullish copper as
leading indicator for a surprisingly strong comeback of inflation into 2020/2021 is the new high probability base case scenario.

Precious Metals

December 2015 was an 8-year cycle bottom in gold that is trading in a long-term bull market. After being bullish gold in 2019, we expect 2020 to be a trading year for gold. After a Q1 overshooting, we see gold vulnerable for a washout (rising yields) into summer/H2 before resuming its long-term bull market into 2021 and where silver will likely provide the +beta out performance to gold.
Asian/EM strong performance at this late cycle bull appears likely. With the bearish USD view, the MSCI
Emerging Market is likely in the early stages of a new cyclical bull market into H1 2021. Regional out performance by bullish China and Korea.

Japan has been trading sideways for nearly 2 years. With our bearish JPY view, we are bullish Nikkei-225, where we
expect a larger wave 5 to overshoot towards 30.000 into H1 2021.

Bonds:

The August low represents an early 4-year cycle global yield bottom where particularly the yield crash in Europe had all signs of a bubble top in bonds. Bonds are bearish in 2020, where after a tactical Q1 pullback, we should expect US 10-Year yields moving towards 2.6% – 2.8% into initially summer and ultimately into H1 2021.

Overall it would appear that we have the next piece in a potential structural comeback of inflation into this next decade, where at the end of the day, the likelihood is of moving into a stagflation rather than inflationary scenario. Rising inflation sooner or later kills every bull market (cyclical and secular bull markets). Analytically, this means that as long as we do not see a significant pickup in inflation we are in the sweet spot of a classic “goldilocks” scenario which is bullish risk. Having said this, if US equities are trading in a major new “wave V” and therefore moving into a secular peak, we should implicitly see very soon a significant rise of inflation, which is our main base case thesis for the next 2 years.

Summary

Despite the S&P-500 hitting new all-time highs in H2 2019, the 2018 long-term macro base case/cycle roadmap is unchanged albeit the timing is more complex. Particularly in the US, the current Juglar Cycle is extending where the length of the current economic expansion has reached record territory. However, the probability is that the
Juglar Cycle is mature/toppish and where a decline into a stag flationary recession is imminent, although the timing of the decline has obviously changed to the original 2018 scenario.

Cycle extension has also changed the larger Elliott Wave count. One consequence of this is, that we have to adjust our long-term Elliott Wave count in the S&P-500. Originally, we thought that the 2018 boom & bust cycle top was a major wave 5 top, and where our suggested early 2020 4-year cycle low projection and the subsequent bull cycle (accompanied by rising inflation) into the first half of the new decade, we would have already seen in the context of starting into a secular sideways trading range. Fact is, that with the US economic cycle extending, we are factually still in the old regime, so where we see the December 2018 S&P-500 low at 2347 as the bottom of a larger wave IV correction.

Conversely we can see for the MSCI World, the whole 2018 correction cycle has the structure of the favoured larger A-B-C correction cycle, in the S&P-500, wave IV was just a short and sharp correction. With that wave count, we see December 2018 as the formal starting point of a major wave V, which we think will complete the 2009 bull market in the first half of the new decade and which leaves our long-term cyclical model unchanged.

Concluding Words:

Our models and the recent price action sets the high probability base case which has not changed since last years projection that in the first half of this new decade we will see a generational turning point in financial markets, setting the trends for more than a decade into the 2030s.

Ill try and provide a part 2 to this summary release to drop down into regions and sectors and some individual picks. The concluding words shouldn’t surprise long term readers here and are ominous indeed. I will try and provide some additional words on these comments on the part2 post.

I will you all a very prosperous and happy and healthy 2020.

All the best

Rich

p.s. some comments here on gold and the important eurusd from Fitzpatrick at Citi

Top Citi Bank Technical Analyst Tom Fitzpatrick:  Our bias remains for a move towards $1,700+ at a minimum with an argument to be made for a possible move to and maybe even above the all time highs.

Despite Pullbacks, $1,700+ Gold Is On The Way

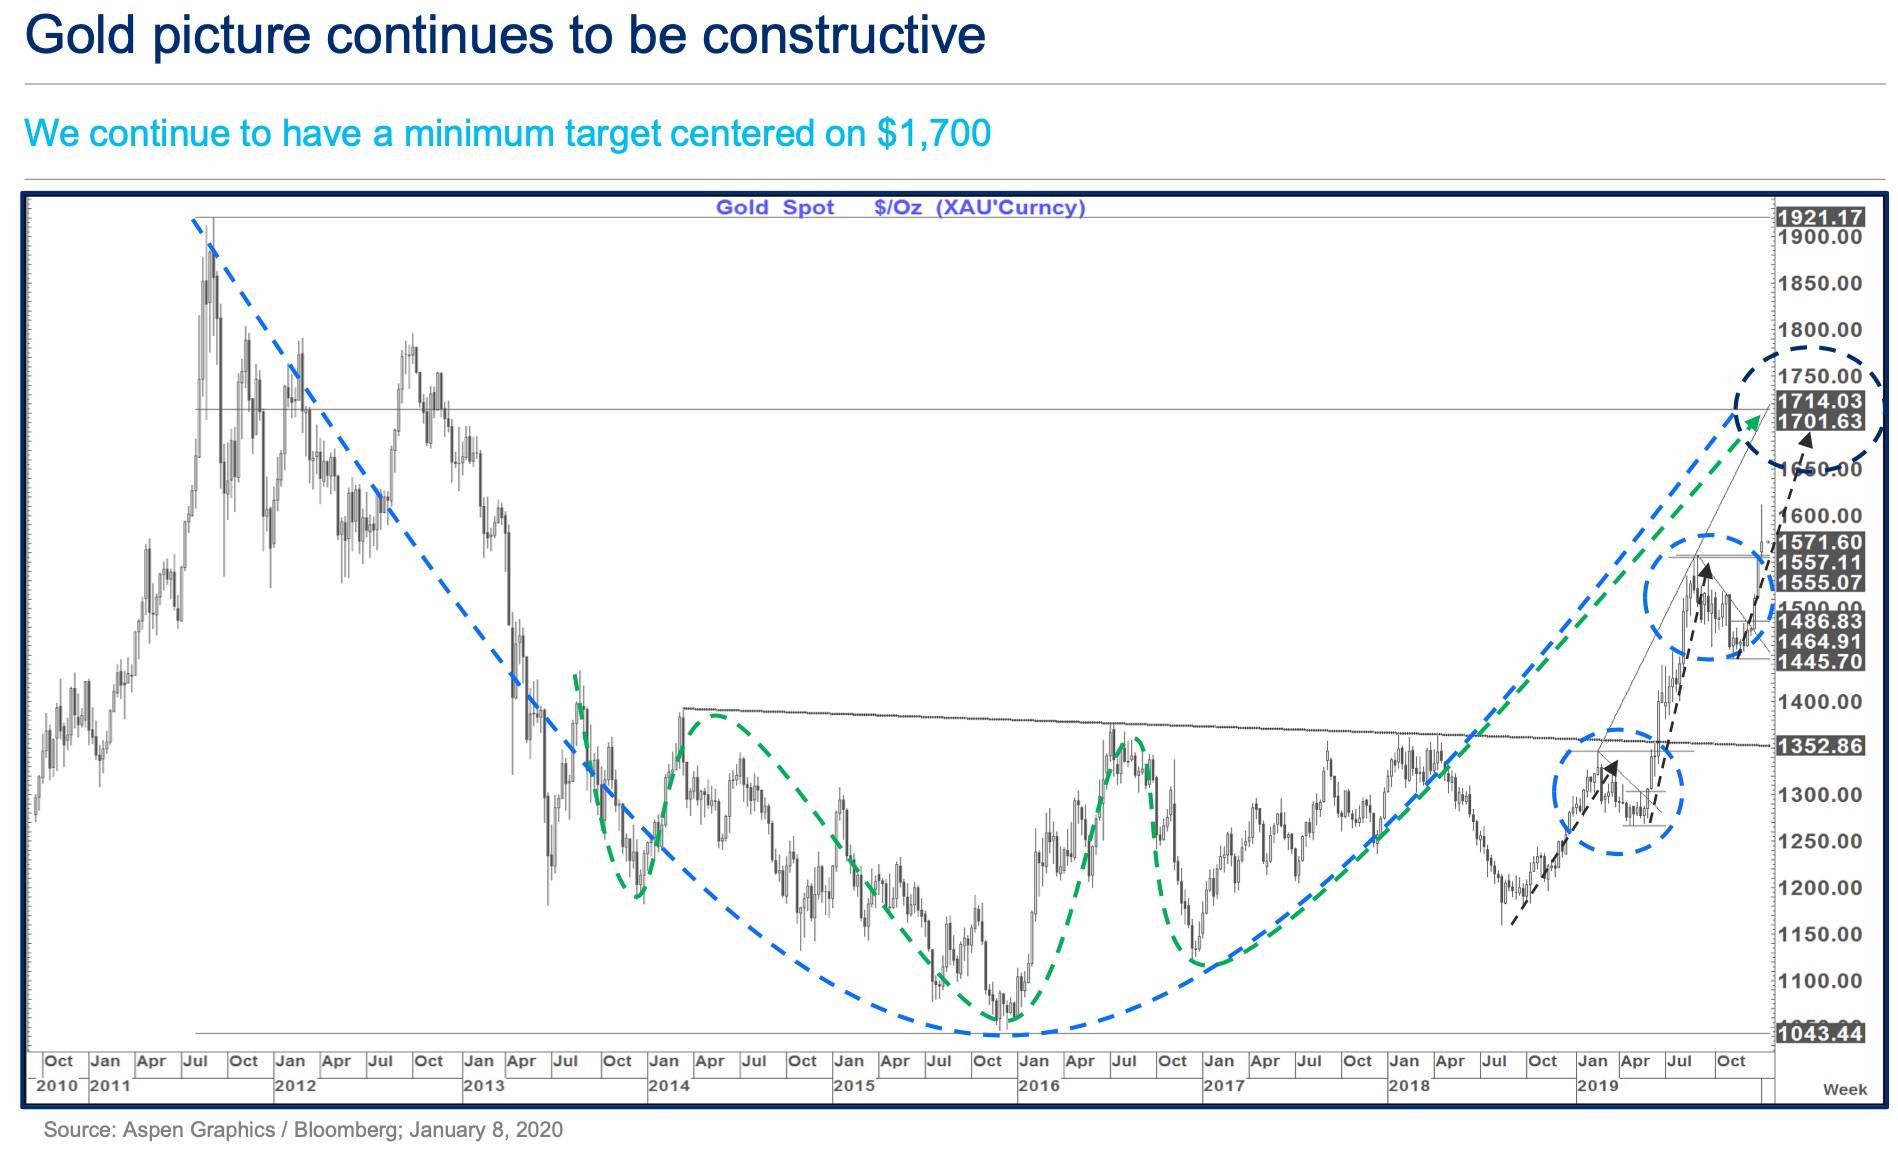
We continue to hold the view that Gold can head to at least the $1,700+ area (possibly in Q1 2020).

This is both the target of the inverted head and shoulders and the 76.4% pullback of the fall from $1,921 to $1,043. The rising trend line off the Feb and Sept 2019 highs also converges with this area…


While the initial break higher this month was accompanied by elevated geopolitical risk the underlying picture looked bullish long before this development. This suggests that while some calm on that front might create a bit more choppiness near term they underlying bull trend remains intact.

Gold Price May Hit New All-Time Highs

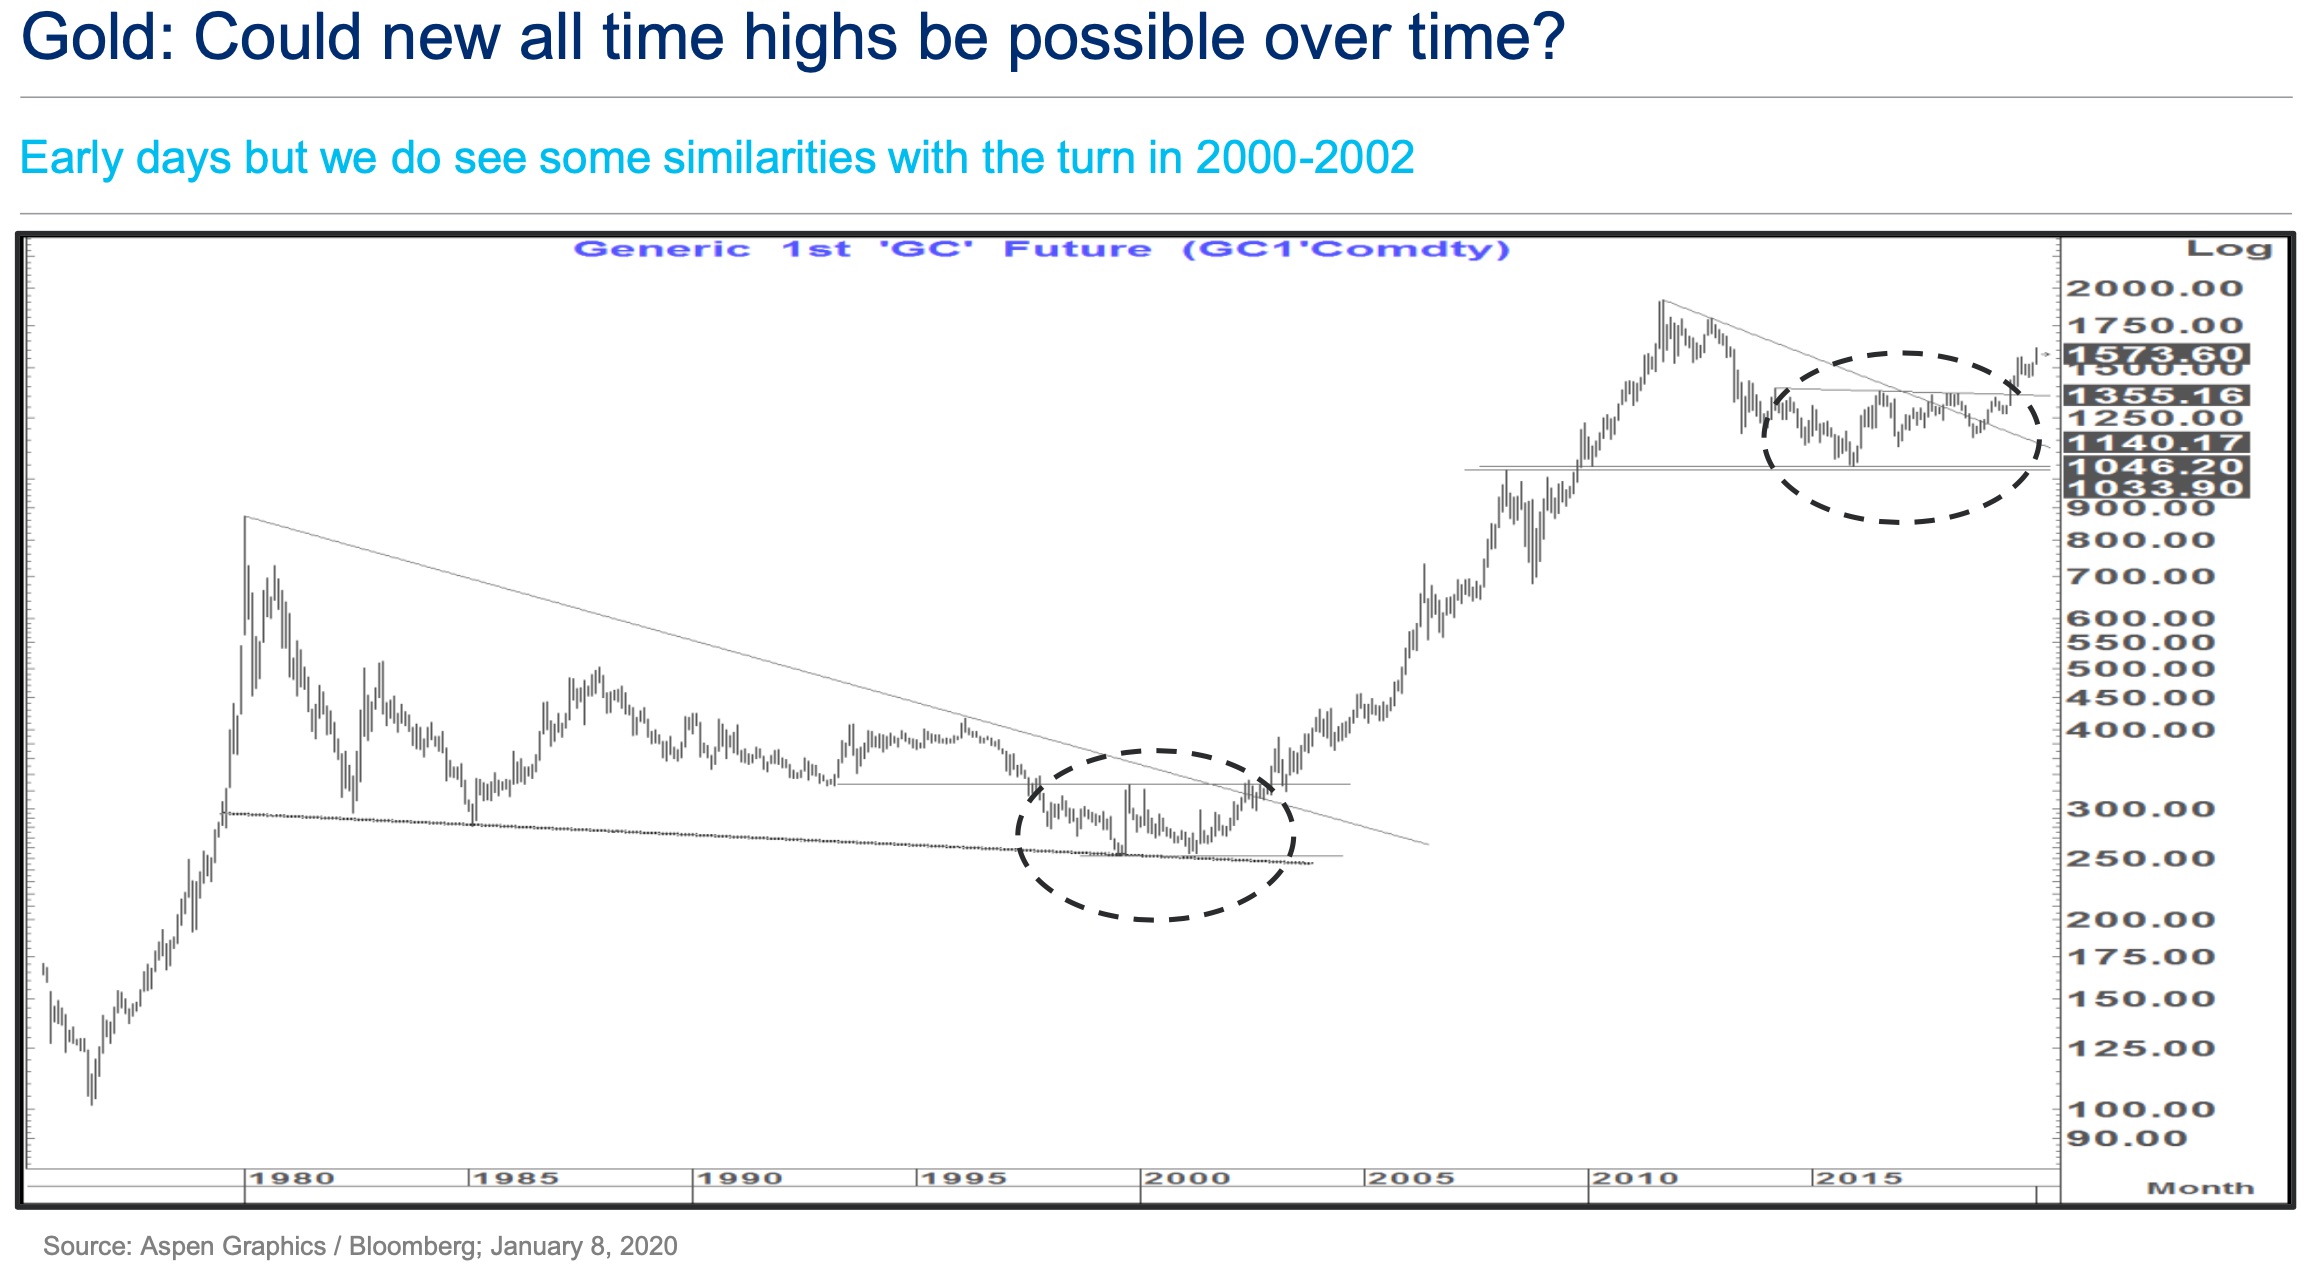
From a US economy/USD perspective we have been very focused on 2000-2002 (Not so much from an equity market perspective). That was a period that saw a trend low forming in Gold before a sharp turn higher.

Gold May Hit $2,100 This Year
Ultimately that resulted in a move to new all time highs (which required a much buffer percentage move that we would need today as the correction in 2011-2016 was much shorter in timeframe and shallower in magnitude than that seen in 1980-2000.) Even if we are on the page of the low to high bounce seen in 1985-1987 (Fitting more with our preferred Equity period where we are looking for a 15% up move in the S&P this year like that seen in 1986) it looks constructive for Gold. In 1986 Gold had a low to high move of 37% and an up year of 23%. 

Similar numbers if seen this year could see Gold trade as high as $2,100 this year and potentially close the year as high as $1,870. 1986 was also a year of significant USD weakness.

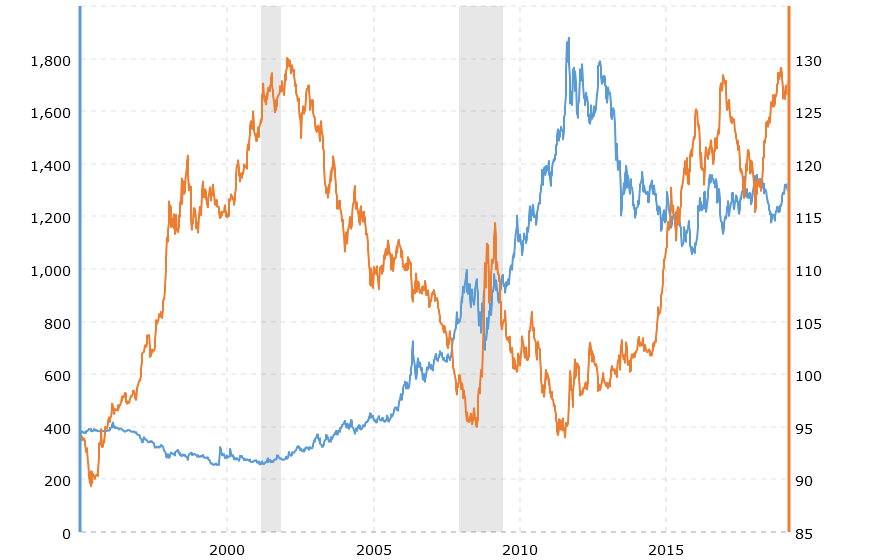
Since Gold peaked in 2011 there has (not surprisingly) been a close correlation to trending moves in Gold and in the USD (EURUSD used above). 

Where those relationships broke down for a period- Gold has tended to ultimately give the correct signal. 

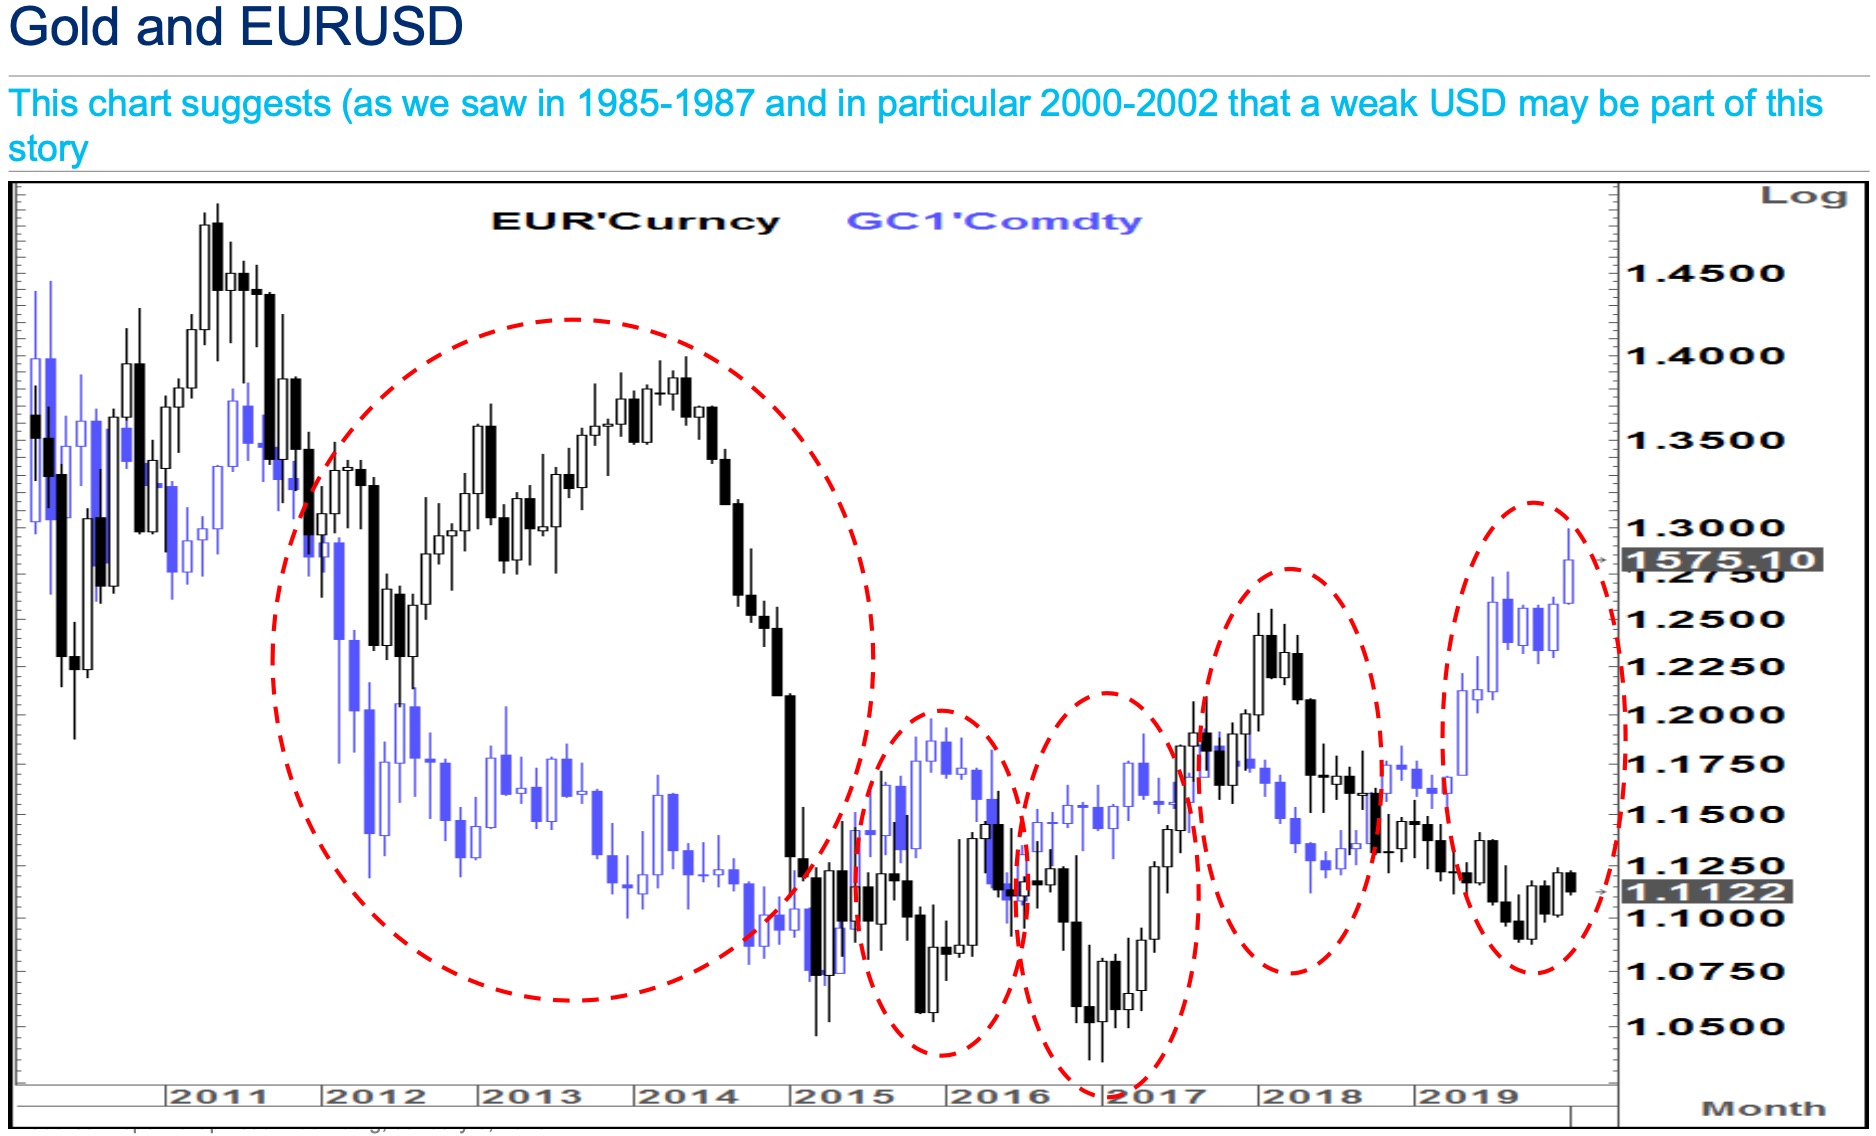
That divergence is now the most severe since it happened in the other direction in 2012-2014 after which EURUSD fell sharply. The present pattern on EURUSD has been an almost perfect mirror image of that period.

GOLD CATALYST: US Dollar Set To Plunge

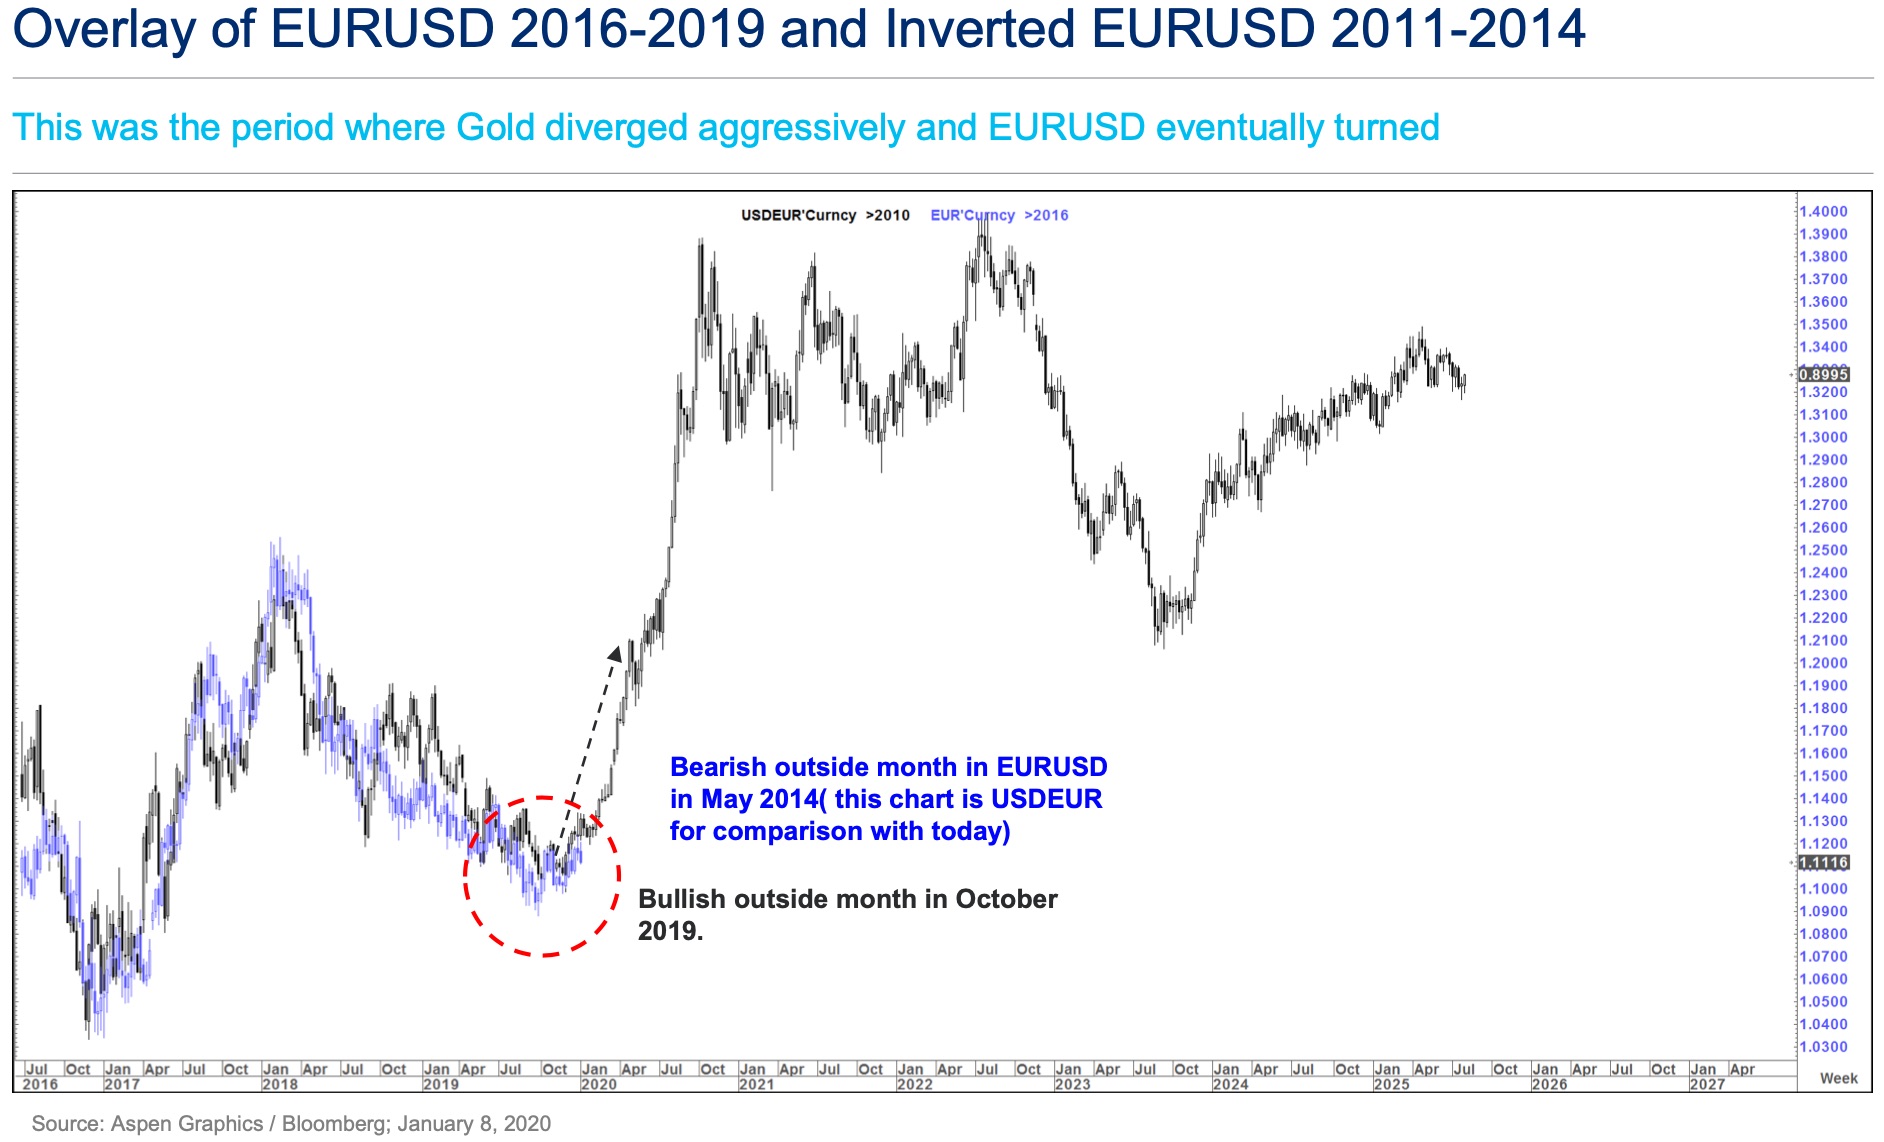
The turn in EURUSD took place at the peak in May 2014 when it posted a bearish outside month. EURUSD posted a bullish outside month in October 2019.

As you can see price action continues to mirror that turn quite closely. It is worth noting that once EURUSD closed below the 55 week moving average in July 2014 it never looked back. The 55 week moving average (not shown) presently stands at 1.1196 and a weekly close above, if seen, would add to the bullish case.


Technical Analysis – SP500 Rotating Higher, Asia EM Breaking Out 5th Nov19

Its been a while since i updated here.

The wave C in risk off that was forecast by the Swiss team just didn’t materialize. The technical setup was clear with multiple death crosses and the exploding challenges in the repo market along side many key markets weakening considerably or slipping into a technical recession inc Germany, Italy etc.

But Central banks stepped up to the challenges once again as we have seen so many times before and their actions and guidance prevented the technical patterns from realizing their potential.

Instead we have the cycle back into cyclicals and this time with the emphasis on a weaker US$ and instead all yes are turning to an inflationary setup which means industrial commodities and energy. Both have been fairly unloved sectors, especially energy so the reversal has been quite impressive in these sectors. The jaw boning by the FED especially has been strong with Powell’s comments last week materially changing the guidance:

“I think we would need to see a really significant move up in inflation that’s persistent before we would consider raising rates to address inflation concerns.”

You have to roll with the ever changing market dynamics and especially the central banks monetary measures. It was touch and go but ultimately, if structural damage to functioning markets is not a factor in their decision making, then their actions will alter market pricing outcomes. Gold continues to see good support though for as long as other securities see upside it seems its the market laggard rather than the alpha or + beta to the average.

To the immediate tech

US markets:

After breaking its 3028 all-time high and with further breakouts in key sectors (biotech, miners and oil) the SP500 is heading to an initial target projection of 3086 to 3109. Trading wise, with our daily momentum work reaching overbought extremes and short term sentiment heading into contrarian territory (low put/call ratio) the air is getting thin, where the SPX is moving into a short term trading top followed by a minor pullback into deeper November.

However, without any bigger divergences in medium-term indicators it is too early to call any bigger tactical tops, where it is still likely to see more selective strength into December but where the overall market momentum declining via potential real breakdowns in defensives (Utilities, Reits, Healthcare, Pharma, infrastructure), which should weigh on the SP500.

Tactical short-term resistance in the SP500 is 3086/3109. Support is at 3028/3000, where a re-test is likely into deeper November before the probability is to reach 3150 into December. For as long as policy makers are expanding balance sheets again cyclicals over defensives should remain the theme.

Within cyclicals there is also some rotation of the + Beta crown where its clear there is a rotation starting with breakouts in resource sectors (tracking Asia break out). The tactical sentiment climax of this rotation trade will only reach its peak point, when we see real selling pressure and technical breakdowns in defensives which is missing at present. Therefore tactically the setup is to buy any dips in cyclicals (and resource within cyclicals) into deeper November.

Cyclical models :

With the mid-October breakouts in US banks BKX ( GS Catch up candidate) and semiconductors SOXX (Nivida, Intel) as early cyclicals there is clear evidence that the suggested major mkt rotation into cyclicals has started. With the break of the SP500 3028 all-time high participants got the final confirmation that the bear C wave setup was broken and that the US markets (QQQ, DIA) but (IWM, NYSE still to breakout) are trading in a new selective bull market, where the index momentum should remain weak. Where tactically a weakish start into 2020 (later Q1 washout) but where the markets remains underlying bullish into initially Q2 with an SPX target 3240/3300.

European Markets:

Europe has been outperforming the US from its mid-August trading bottom on the back of the initial rally in
cyclicals (green shoots), and where over the last three weeks we have seen trend reversals in core cyclical sectors (SXAP, SX7P), with SXNP, SXIP and SXOP hitting new all-time highs, and where we see initial breakouts in major headline indices.

Again, with the OMX-30 (resource + Beta heavy) we have just the first major market in Europe breaking out to a multi-year high, and where the key breakout levels in the STOXX-600 are also not far. Short-term, Europe is increasingly overbought, and the Euro Stoxx is heading into resistance at 3700. For a potential pullback into deeper November we have support at 3550. Probability is to stay bullish cyclicals into December. (FTSE100 also resource heavy should be a European +beta on the narrative of the reflation trade).

FX Mkts:

In FX, the mid-October breakdown of the 2018 bull trend in the DX must be seen as ultimate evidence that the suggested major wave 5 for the USD top is in place. This de facto means that we see USD trading in the early stages of a bear market versus key pairs such as GBP, EUR, CHF, SEK, CAD and most of core Asia, and which on the macro side is a major game changer back into a reflation cycle.

Short-term, tactically the USD is oversold and we expect the DXY to be on its way into a minor trading low later this week for a bounce into deeper November but where into year-end expect more USD weakness.
Commodities: Gold remains in neutral position between $1557 and 1450 but where on the back of the weak USD and the breakout of Asian/EM the focus starts moving into the broader commodity complex with major bottoms forming in copper (COPX, ANTO, BHP, RIO), soft commodities and where in the energy complex (note XOP, LUKOIL) see a breakout in NatGas. (Note Gazprom)

With the break of the 2018 downtrend in the equally weighted CRB index we get a first significant breakout confirmation, which importantly will likely be the leading story for higher inflation into 2020!
Asia/EM: Asia and particularly China has been lagging the initial breakout in the MSCI EM. With yesterday’s rally, the number of breakouts in Asia is increasing with the Hang Seng breaking its 2019 bear trend, where we have a smaller breakout in the HSCEI and where the KOSPI is breaking out relative to the world. In the SSEC our focus in on the key resistance of 3048, where we would see a breakout as the starting point for a wave 3 rally.

Buy any dips in asia and em to expect more strength into December!

A few third party reports:

Waiting_for_USD_turn


*DISCLAIMER – ANY COMMENTS ON LISTED SECURITIES ABOVE ARE SIMPLY A VIEW AND NOT UNDER ANY CIRCUMSTANCES A RECOMMENDATION TO BUY OR SELL. PLEASE SEEK ADVICE FROM A REGULATED FINANCIAL PROFESSIONAL FOR ANY INVESTMENT ADVICE.*

Technical Analysis – Confirmed, Risk Assets in Wave 3 Breakdown -12th August19

I hope all are enjoying their summer breaks here.

Certainly listed securities of all shapes and sizes are moving here and we see major new trends taking hold and old trends gradually breaking down. For those that have positioned correctly (and incorrectly alike) this is a wealth transformative period. Volatility and directional speed is likely to increase here rather than subside.

Many subscribers have been heavily long precious metals over the years and more defensive type stocks s-reits included so hopefully all are feeling the upside of the 2019 moves. This has been a journey and continues to be a great journey that some readers here will remember. The journey has taken a giant step forward this year.  I just remind that we are, most likely, very early into these new trends. I wouldnt consider hitting that sell button too soon therefore on pm bets that you may have made. There will however likely be a lot of price discovery until the trends are fully joined by the pack.

My own book, like yours no doubt,  is experiencing a dramatic growth rate but i feel a great calmness about all this which is probably a very good thing. I hope all have experienced a good return rate here, you should have if you have followed these pages.

Without wishing to sound like a philosopher (aka Soros, god forbid!) my own feeling is that there is no need to shout this from the roof top. Wealth gains via correctly assessing listed security prices and their movements is a fine art that cannot be explained easily. 90% of small investors lose money or massively under perform and this will always remain the case so there is no point in evangelizing these things in my opinion. Experience has taught me this and so be it.

If you are experiencing transformative wealth gains here be humble and sanguine about it. Hard work and no doubt a little luck have allowed you to win some time and opportunity to experience more the world.  Monetary units are simply claims on units of labor that the fortunate amass.  Which is also why central banks stealing our units and giving them to their buddies is just so unjust

To the Swiss team:

July Top Confirmed
• US Risk (tactically) : Over the recent weeks it was clear there were deteriorating market internals, the increasing divergences in indicator work,and the distributive signals (several Hindenburg signals were triggered) as leading indicators for moving into a major wave B summer top, which from a cyclical aspect looked likely to be a July top and closely correlated to last week’s ECB/Fed meetings. Together with the escalation of the Sino/US trade conflict and the break of the 2973 key support, formal confirmation that this is the starting point of a short but sharp correction cycle (with SP500 targets minimum 2730 and more likely 2600) into initially later August and ultimately into first half October where we have our next tactical buying opportunity.
With last weeks sell off (91% down volume event) the SP500 was oversold where a bounce of 1-2 sessions occurred. However, without signs of a real capitulation (missing spikes in fear indicators),  more downside is extremely likely, where we have a minor trading low projection for a somewhat more significant rebound into first half September before expecting more downside into first half October.
After the break of 2868 we have a next support/target at 2770 to 2730. Breakdowns in cyclicals, technology and small & mid-caps are underway but where defensives remain key. With an initial break down in staples and utilities/healthcare sitting on the edge defensives are the real threat for the SP500, since a broader breakdown in defensives would put further pressure on the SP500.

Note, Same applies to other markets. With yield curves flattening and central banks jaw boning and in some cases already acting to bring rates down the hunt for yield is temporarily holding up some of the defensive issues. Capitulation of market participants is when we see a rush for liquidity and therefore the exists from all risk assets, yielding and non yielding alike. We don’t see this yet but it is to come.
• US Strat:

  • Major Q1 2018 top and start a larger A-B-C corrective (trading) bear market. With the December 24th low, the SP500/global equities completed bear wave A.
  • December low of 2351 the basis for a larger wave B rebound cycle into summer top before global equities roll over into a wave C bear cycle. where strategically we expect a
  • Wave C – Re-test of the December bottom at 2350 into initially early Q4 – and ultimately into Q1 2020.
  • O1 2002 completes the 2018 corrective cycle and this is the starting point of a new 2-
    to 3-year lasting cyclical risk bull market.

European Risk Markets: With Europe under performing and after the late July false break in the Euro Stoxx, last week we saw our suggested reversal, where the subsequent break of its key support at 3467 was the trigger for an impulsive wave 3 breakdown. Europe was oversold and we can saw a bounce off from its 200-day moving average (Estoxx at 3300 and DAX at 11600). However, with key sectors trading in an impulsive wave 3 down, it is very likely to see more downside into next week, where an undershooting towards 3227 and 3152 in the Euro Stoxx is likely.
• Macro/Inter-Market Analysis: On the macro side, our focus remains on the USD and its increasing selectivity. On track with our core case, we saw a new and impulsive USD breakout against the Asian/EM/commodity block, where USDCNH has broken its major threshold at 7.00 and which was the suggested trigger for significant higher cross-asset volatility. In the high beat complex key pairs (CNH, KRW, SGD, TWD, NOK, SEK) are trading in wave 3 up, where apart from a short-term pullback its likely to see further USD overshooting into later Q3, the preferred timing for a major wave 5 USD top. On the other hand, the heavy weighted EURUSD saw the undershooting below 1.1100 but where our suggested risk-correlated (funding currency) re-break above 1.1100 has triggered a classic short squeeze, which makes the August 1st low at 1.1025 as a candidate for a major EURUSD low.
Bonds: Tactically, we saw the early July bounce in yields as just a corrective rebound before we expected the next break down in yields below 1.80% into later Q3. Last week’s sell-off in risk markets triggered a somewhat earlier breakdown (minor wave c bounce failed) and with the new impulsive move, US 10-year yields have reached our next major target below 1.80% earlier as expected, which makes it more and more likely to see a serious re-test of the 2012/2016 bottoms below 1.50% into later Q3/early Q4.

Industrial Commodities: The pressure in economy sensitive commodities remains imminent where copper is sitting on the edge for another impulsive breakdown.

Gold we see a new risk-corrected breakout with Silver and Platinum likely to provide the beta. Although gold is trading in a minor wave 5 (as part of a larger wave 3), the break of $1450 is bullish and opens the door for a tactical overshoot towards best case $1580.

Asia/EM: With the impulsive breakout in USDCNH, Asia/EM is under pressure, which confirms the risk case of a wave 3 breakdown in the MSCI Emerging Market. Key markets such as the HSCI and the KOPSI are on the way of testing their October lows, where a breakdown is increasingly likely. The S&P/ASX-200 is breaking its 2019 bull trend and together with USDJPY in a wave 3 down. The Nikkei-225 is also poised for a break of its June low at 20.306. Tactically bearish Asia/EM and likely to bet the downward beta region into a later Q3/early Q4 before a major buying opportunity is likely to present.

I leave you with the thought of whether we have reached a relative purchasing power value ceiling in terms of the major equity stock indexes but this later. Central banks can of course drive up nominal prices but in terms of relative value it seems most asset markets (bonds, housing, equities) appear capped here which would have major implications for the prices of precious metals going forward.

All the best

Rich


Technical Analysis Update – “All Eyes On Rates” 17th June19

Its been a month since the last update but really major equity prices are barely any different. What has changed are rates at the ten year, the yield curve inversion and the price of precious metals which are at close to 5 yr highs.

Lets skip to the guy’s views.

Summary, the May price bottom for risk assets is in place and the high pessimism pervading the market implies more upside yet to come.


Us Risk – Tactically, from a cyclical aspect, late April saw a top from where we expected a pullback into late May earl June as the set-up for a bounce into best case early July but which should be part of a larger distributive top building process. With last week’s sharp bullish reversal, and the rebreak above 2800, we got a clear trading long signal, which formally confirms our anticipated trading bottom and makes
the June 3
rd low at SP500 2729 to a new pivotal support. Although on a very short-term basis the SP500 has worked off her over bought levels and with a new breadth impulse and still too pessimistic sentiment indicators, more upside into late June/early July time window is the probability trade.

The June 3rd low at 2729 is a new medium-term pivotal support. Consequently, as long as the SP500 trades above 2729, the market remains per definition bullish biased into initially later this week and more likely into early July, whereas a break of 2729 (regardless of timing) would trigger a major bear signal into late Q3/early Q4.


With last week’s bullish breadth impulse and looking at the still high pessimism, a previous case scenario to see a marginal new high towards 3000 to best case 3050 is on the agenda. However, with the weekly trend rolling over, larger divergences forming between early cyclicals (semiconductors, banks and transport) versus the SPX and defensives trading in wave 5, the 2019 strategy call that the SPX and global equities should move into a major wave B summer top as the starting point of a new bear cycle (wave C) into initially late Q3/early Q4 holds.

On the sector work, the bounce in cyclicals is underway but this bounce should post a major lower high into June/early July. The surprise last week was the rally in defensives, where utilities and staples marked new reaction highs but which we still see as a wave 5. With yields basing, we would not chase defensives and
concentrate on our tactical bounce call in cyclicals.

European Risk Markets: Following the cyclical model, the suggested bullish reversal in Europe played out, where the break of the late April down trend is the formal confirmation, that the late May trading bottom is in place, which makes 3249 eurostoxx50 a new pivotal medium-term key support.

Short-term, most risk markets are getting were slightly overbought, but however, key is that with the EUREX put/call ratio still at outright contrarian levels, it is likely to see further squeezing into late June/early July, where a re-test to marginal break of
the late April high towards 3550 is still likely.

Sector wise, oversold cyclicals (SXPP, SX4P, SXOP) where SXAP and SX7P are catch-up candidates.

Macro/Inter-Market FX: On track with the short-term cyclical roadmap, the USD is pulling-back, which last week gathered some momentum but which is likely a tactical event within an intact long-term USD bull trend, where into deeper summe a new USD high is the probability. Short-term, the DXY is oversold and reaching support (200- day moving average) where we think most of our suggested tactical pullback into June is behind, so where further USD downside from here should be limited in price and time.

Commodities: Crude oil has posted our suggested (risk correlated) late May trading bottom of $51.00 to a new pivotal support. As long as it holds, we can see further bouncing towards $58 best case 60 into later June before a new down test starting into later Q3. On the metals side, we have seen our suggested USD related bounce in
gold but where the 1350 level is a new key resistance. As long as gold trades below 1350, we see the risk of more corrective work into later June before the ultimate breakout attempt starting. Gold and gold mines are a buy into late June weakness.

Asia/EM Risk: An oversold bounce in Asian markets is underway, where the Nikkei has broken its short-term downtrend, where we have intact long signals in the KOSPI and where China is basing. Short-term, we expect more corrective bouncing into deeper/late June but where we continue to expect Asia/EM to move into a lower trading high versus its April high as the set-up for a major breakdown into later Q3 2019.

Crypto wise the tactical bull trend continues with a renewal of momentum. 10400 in line of sight now.

All eyes to the Fed for the near term tactical moves but recall the tactical levels above. Watch for false breakdowns if rate disappointment as given the pessimism these are very likely excellent trading longs for risk assets as near term tactical trades.

All the best

Rich


Weekly Technical Analysis – Weak US Breadth, Asia EM Breakdown – 2nd May19

Guys apologies for the delay in posting,

Here the latest summary from yesterday. Thanks for the continued support..


US Risk:

Since end Feb, there has been increasing selectivity in the US market but where an intact sector rotation and technology mega cap out performance has, so far, prevented a bigger pullback in the SP500. After the recent
breakdown, healthcare and banks bouncing (despite lower yields), mega cap tech out performance against initial reversals in cyclical key sectors (DJT, SOX, XOI), and continued weakness in the commodities camp, we have further weakening internal breadth (very weak number of new highs and stocks trading above 200 & 50 & 20 day moving average, also new 52 week highs very weak). Although last week’s new high in the SP500 surprised me and the Swiss guys alike (against the new USD breakout), the US market is short-term toppish and set for a short and limited pullback into first half May before starting its next bounce higher into June/July, which was and remains our preferred timing for the end of the wave B rebound cycle. With hitting a new all-time high, the SPX is overshooting our 2920/2930 cap towards 2970 (and the big psychological area of 3000).  A re-break below 2913 would
be initially negative and imply a pullback towards 2896 and 2820.  In utilities we would keep the key support at 767 on the radar. Other than that, our focus remains on buying the dips in cyclical sectors into a potential early May pullback.

US Risk Strategy. 

There is no change to the ABC correction that is underway. A wave – to Dec18, B likely to end June mid July19 and a vicious C wave thereafter. With a record short position in the VIX index it is very likely we’ll see another classic volatility event (sharp and sudden C correction) in H2 2019!

European Risk Markets: Despite initially increasing selectivity (strong DAX, OMX, SMI hitting new all-time high) versus reversals in most core markets and small & mid-caps trading sideways), we have an intact bull trend in Europe. Having said that, with our toppish trend indicators, a very low put/call ratio, and our suggested initial reversals in cyclical key sectors (SXPP, SXAP, SX4P, SX7P, SXEP). Europe is likely set for a short pullback into first half May before starting its next bounce higher into June. A break of last week’s reaction low at 3476 would be short-term negative an imply a pullback towards 3400/3370. Sector wise the focus remains on buying/adding into an early May dip in cyclicals.

FX: On the FX, on track with our underlying bullish USD view, we saw last week our suggested break of the November/February key resistance at 97.50/97.66 in the DXY. With a fresh breakout in KRW and
IDR we see increasing momentum in the Asian/EM dollar index (bottom confirmed). On a very short-term basis, the USD is overbought where a breather is normal. However, after the new breakdown in the EUR (still no signs of a capitulation), the breakout in CHF and key pairs (AUD, CNH) siting on the edge, we continue to expect more USD strength into summer where in we have a likely first major tactical top projection in the DXY.

Asia/EM Risk: We have been bullish Asia/EM since the October lows but it was our strong believe that our expected USD breakout (KRW as key trigger) would suggest Asian/EM equities moving into underperformance. With last week’s US breakout and commodities breaking a key support we got a new relative breakdown in the MSCI Emerging Market. In Asia, the selectivity has been increasing with China selling off from its March (bubble volume) blow-off top. We have bigger reversal underway in the RTS and in the BOVESPA and NIFTY our focus in on key supports, which are the March/April lows!! Tactically, we are sticking to our underlying cyclical roadmap and continue to expect more weakness into first half May before starting its next bounce into June/July but where it’s likely to see more EM under performance.

Commodities: In gold, we see our suggested oversold bounce but as long as we do not get any real and confirmed USD reversal, we see any rebound in gold limited and where platinum remains our outperformance call in the precious metals complex. Generally, with another major lower trading top in the CRB index (equally weighted), there is more risk of USD- related weakness in commodities and crude oil (last week sharp reversal) into summer.

More to come..

Rich

Weekly Technical Analysis – “SP500 Minor Top” – 12th April19

Good evening guys,
Apologies for the delay in posting. The long expected weakness in risk markets hasn’t shown as yet but the stresses remain in place (eg divergent 52 week highs for many indexes) despite some renewal in the cyclical themes, eg the Soxx making new all time highs or +40% in the last 3 months or so.

US Risk
Over the last few weeks the forcast has been for the increasing selectivity/rotation in the US market. From late
February into March we saw significant (6% to 14%) set-backs in the broader market and cyclical sectors, whereas
defensives outperformed on declining yields. The ongoing rotation was the reason for the resilience of the SP500 and the higher reaction low, which the market posted into later March as the trigger for a rotation from overbought
defensives back into cyclicals. After last week’s aggressive rally, cyclicals are again short-term overbought. Together with the SP500 heading into a minor top projection it remains the base case that the market will likely move into a deeper April trading top for a short/limited pullback into later April. Into early summer it remains the probability for an underlying bullish projection but where further deterioration in index momentum via a classic distributive market environment.
Tactically the distribution we are seeing over the last 5 or 6 trading days demonstrates the SP500 should remain short-term capped at 2900. The focus however should remain on buying the dips in cyclicals instead of chasing the broader indices on the upside. Trading support is last week’s breakout level at 2860. A re-break would suggest a pullback towards 2785/2760 into later April. On the upside, early summer remains the likely time window for the top of the wave B rebound cycle and where we should expect the SPX to reach 3000.
It should be noted that the VIX shorts are reaching extremes which is starting to signal extreme volatility ahead.  the short positioning in the VIX index moving back into extreme territory provides the risk of another volatility event over the next few weeks and into early summer is clearly increasing. This indicator provides an indication of the probability of a “mini crash” type event. From a cyclical aspect, the earliest time frame for such an event in
June19.

European Risk:
After the impulsive and aggressive rally in cyclical sectors from the late March reaction low, Europe
again is short-term overbought. Tactically, the EuroStox50 is likely short-term capped on the upside and set for a limited pullback into later April before we expect more upside into early summer. Index-wise, we expect the sequence of higher lows to remain intact with 3280 as a key price support. Into early summer we expect the Euro Stoxx to test 3500/3550. Sector-wise, buying the dips in cyclicals into later April should remain the focus. In defensives we would use strength to sell/take profits where key sectors such as food remain record high overbought.
FX Mkts 
Momentum in the major FX pairs remains low. The selectivity in the USDvis increasing where in the EUR we see a classic oversold bounce but where in the Asian/EM complex we have a breakout attempt underway, leaving our tactical view unchanged. On a very short-term basis, we can see a pullback in the USD into deeper April but as long as the DXY trades above 95.82, we remain underlying bullish-biased, where into deeper summer we expect more USD strength particularly versus the Asian/EM block. USDCAD is has mixed signals with the longer term pattern remaining strong but the Cad experiencing a bid from its positive correlation to the strength in the oil price.
Asia/EM Risk
Most Asian markets are back above their 200 day moving averages and the MSCI Emerging Market is moving towards our next target at 1100. Short-term, however, Asia/EM is overbought and with initial momentum divergences and increasing selectivity (India losing momentum, Korea underperforming, versus China/Taiwan outperforming)  a short-term pullback into later April appears likely before another bounce into early summer. However, with more US$ strength likely versus the Asian/EM complex, we wouldn’t be surprised to see Emerging Markets topping out earlier than developed markets and underperforming into deeper summer.
Commodities
Crude oil is reaching its next big target at $64.00 (62% retracement of 2018 bear cycle). Crude is
overbought, it trades in a minor wave 5 and we see crude on the way into a 2-months cycle peak as the basis for a tactical pullback into later April. However, with strong seasonality and while trading above $58.20, the underlying trend remains bullish into early summer, where we can see crude oil reaching $69. G
old, has seen a corrective pullback from its late February trading top. An important tactical bottoms is forming (1280  as an important support) and where platinum outperforms (testing its 2016 downtrend). With constructive patterns, we see gold and silver as likely bounce candidates but where gold needs to break $1324 to open a more significant breakout campaign.
Bitcoin remains in her tactical bounce pattern but her trading is erratic with large lumpy moves in either direction.  Whether its anything more than a corrective bounce remains to be seen. There is no evidence of anything more than this for now.
All the best
Rich

Weekly Technical Analysis – “SP500 Tactical Weakness” 25th March19

Apologies for the delay in posting this. This is last week’s update but the analysis is sound and I will update in the next 48hrs with the latest print.

US Risk:

After the early March risk pullback, following the tactical pattern, where into option expiration you often see the market holding up its 30 to 60 day trend, a bounce into expiration was the probability and it played out perfectly before the probability dicates another pullback is the likelihood starting into end of March and more likely into early April. Despite last week’s bounce and the SP500 hitting a marginal new reaction high, the depth and selectivity in the US has been further increasing. The rebound in the Russell-2000 and most cyclical sectors is v.likely corrective with these sectors forming a lower high. The leading defensives and technology are overbought,facing resistance and/or losing momentum. On this basis it is very likely that the Sp500 has hit her minor trading top on Friday last week and this level forms the basis as the setup for weakness into end March/early April.

  • Level wise the SP500 is technically capped around 2840 cash. A re-break below 2817 would be initially negative and suggest a pullback towards 2722/2700 into early April.
  • Within this ongoing sector rotation, the market remains well supported. With expecting a minor wave c pullback, early April weakness in cyclicals is an opportunity to buy/add, whereas defensives we see vulnerable for a tactical pullback.

European Risk

Over recent weeks, with the exhaustive overshooting heavy-weighted defensives (“yields low
forever”), Europe has been gaining strength versus the US. Although the Europe bounce into expiration was expected, the prior Friday high momentum breakout in the Euro Stoxx has nonetheless surprised. With trend work diverging at overbought extremes, and following our US call, Europe is due for a short-term pullback. However, without any real top building pattern and an ongoing sector rotation (telecoms in wave 3 and where autos and banks are the next breakout candidates) near-term pullbacks into end March/early April will be limited in price. Likely to the 200-day moving average at 3280 or thereabouts, whereas at 3400/3450 (DAX 11900) the market is likely short-term capped.


Macro Analysis:

On the macro side, the Fed gave dovish guidance last week, and which could provide to be the trigger for higher cross-asset volatility into first half April.

FX Risk

Early March overbought USD was clear for our suggested short-term pull back. But again, as long as we do not see the DXY breaking its late February low at 95.82, we remain underlying bullish USD, where this week we expect the DXY to move into a minor trading bottom as the setup for another bounce and new breakout attempt into April but where we are wary of the increasing selectivity. The USDCAD promises much and the pattern long holds but the dovish fed has slowed momentum and some sideways movement could sustain albeit with the usd bull trend remaining as the underlying.


Emerging Market Risk

Selectivity has been increasing over the recent weeks. In Asia recorded marginal new highs
in China, Taiwan, where India massively outperforms, and where in the broader context we have bullish breakout patterns in Turkey, Brazil and the Russian RTS. Generally, after the recent corrective pullback the MSCI EM is re-testing its late February top at 1070. On a short-term basis, another near-term pull-back into early April is the probability before more strength into early summer. However, an immediate break of 1070 would be bullish and suggest at least short-term a potential overshooting towards 1100 but with selectivity to remain high. 

I’m pressed for time to say more but i will update in next 48hrs. Its been a strong start to the year for my book. I hope all doing well here.

All the best

Rich


Weekly Technical Analysis – “SP500 End March Near Term Weakness” 13th March19

Good evening gents,

It gives me great pleasure to bring you the latest update which to recap is an amalgamation of the traditional reports we used to run in their raw format re-rewitten by yours truly to comply with mifi2 regs. Ideas are not copy write, yet.

Lets start with US Risk:

The rebound in the Sp500 has been the strongest for 40 years. But with increasing selectivity and with the key lead indicators flashing of weakness in cyclicals the  market pullback became increasingly likely. With last week’s break of the SP500 key support at 2775 the sell-off across the market inc Russell2000, we got the formal confirmation that the likely 4-month cycle peak in the SP500 is in place, which in the beta outperforming Nasdaq top still in process. On an ultra short-term basis, the SP500 inc cyclical sectors are oversold which is already being worked off. A false bounce into expiration is likely but should, as a trade, likely be avoided. The daily trend work is still at too-high levels, the put call ratio shows no obvious bias for entry long so the probability is for a continuation of more
near-term weakness into end March. To be clear, this rally has been sufficiently technically strong that it is unlikely to dissipate over night on a swift dramatic reversal. An April continuation bounce of the rally is the probable event.
Sector wise beta outperformance in technology and defensives, sustained weakness in banks (globally). A re-test of 2817 but definitely do not expect a new price breakout. 2682 remains an end march level to watch to the downside worse case 2642, so where we prefer to buy into weakness instead of chasing the market on the upside. 

As a recap the C wave is yet to come, likely in H2, whereby global equities could roll over into a full blown exhaustive c wave high volatility bear cycle target 2070 into H1 2020.

European Risk

Last week we saw initial reversals but where Europe remains resilient and outperforms the US and
Asia/EM via continued out performance of heavy-weighted defensives zirp to infinity and beyond. On a very short-term basis, we can expect a bounce into expiration with even selective new reaction highs. However, with trend work rolling over on extreme overbought readings, Europe remains tactically toppish for a short pullback into later March before we expect the next bounce attempt starting. The 200-day moving average at 3280 needs to be watched. 3230/3200 into late March the probable levels to come into play.

FX Pairs:

Last week’s ECB LTRO decision triggered renewed EUR weakness with an initial breakdown of a key level. The USD strengthened across a varity of pairs as the cleanest yielding dirty shirt.  On a very short-term basis, the USD is already working off its overbought readings. But this is an entry opportunity on patterns that show across the eurusd, usdcad and usdsgd etc.

A new DXY breakout suggests more Asia/EM under performance into later March, headwinds for commodities, gold (minor wave b bounce), and we would see the too strong US$ as part of the likely trigger for our suggested SP500 pullback into later March. Watch the US$ trade deficit, earnings of the mega caps and the ballooning public US$ borrowing numbers. (So much for the cleanest dirty shirt making the yield unlikely to sustain for too long).

Bonds:

In global bonds, yields have started their pull back across the board where particularly in the US and Europe, 10-year yields negated their breakouts. Tactically, into late March, as long as trading below 2.76%, we can expect US 10-year yields re-testing the key support at 2.55%, January lows. 2.40% into early Q2 is likely to come into play.

With the early April yield bottom the correlation to a significant (risk-correlated) tactical bounce in (global) yields into summer remains the base case, especially in European risk equities correlated with rates, we see banks as a contrarian tactical buy into late March weakness.

Precious Metals:

Given the signals of near term (to end h1) the US$ strength is likely to provide an inverse head wind to the precious metals complex.  However as we can see the rising strength of the  US$ is not holding back the precious metals in a classic end cycle insider accumulation signal.

dollar-vs-gold-comparison-last-ten-years19

Crypto Risk:

We have lost all momentum to the upside. If the SEC wanted low volatility to award their etf status on the asset class they now have their low volatility.

As a final side comment its interesting to observe that many so called free floating exotic fx pairs are showing less volatility than their western g10 cousins. How the world is changing.

I hope to bring you more very soon to update this.

Kindest regards
Rich


Weekly Technical Analysis – SP500 Negative Divergences, SSE Volume Spike – 01 March19

Evening guys,

For those that have sold, gone short or hedged this rally its been a patient trade for the last few weeks during which many indicators have been showing impending weakness but price has kept drifting high in this bear squeeze with an absence of any contrarian sentiment top in place.

US Risk: This is now the strongest momentum rally in more than 40 years. Tactically although the rally impressive it hasn’t changed the high conviction, short-term tactical view. The increasing selectivity the internal momentum of the rally has been deteriorating since early February. Indicators like the CBOE put/call ratio are now at extremes, growing divergences on price moment indicators and on the macro side the data from across production to the consumer is clearly rolling over.  And together with our daily trend work at record overbought levels the conviction trade remains to see the US market close to an important tactical top (4-month cycle peak) as the basis for a short and potential sharp pullback into initially early March and ultimately into later March before starting its next bounce higher into early Q2. With Friday’s 2765 level the cash SP500 continues to show the sequence of higher lows as intact but making 2765 a new and objective trading key support. With an intact divergence in short-term
price momentum, the SP500 still trades in the time frame of last weeks suggested minor trading top. On the upside, the SP500 is facing its next bigger resistance at 2817, and with key sectors inc XOP, DJU, consumer staples, housing, and US banks facing resistances a near-term reversal is close and should be the starting point for an initial down test into early March. With a break of 2765/2750 the SP500 should pull back towards minimum 2700 (worst case 2640) later into March19 before starting its next up-wave into late April/early May19.


Cyclically, with the exhaustive December undershooting into the December 24th low, the SP500 completed correction wave A. In this context, we see the December low at 2351 as a multi month low and once this B wave is complete it remains a high conviction to see the risk of global equities rolling over into a new wave C bear cycle with a SP500 target of 2070 into H1 2020. This would complete the 2018 corrective “trading” bear market.


European Risk Markets:

Most of Europe hit a new reaction high last week but with losing momentum and non-confirmation forming across  indicators. Small and mid-caps trading in a wave 5, a divergence building in the DAX and the Euro Stoxx50 heading into resistance at 3300, 200-day moving average. Europe is short-term toppish and vulnerable for a tactical pullback into deeper/later March, Euro Stoxx50 target 3125. The final next bounce higher, into later
April/early May, Euro Stoxx50 target 3400 and DAX 12.000 before the global C wave commences.

FX 

On the FX side, we have seen our suggested short-term breather in the USD. With our short-term momentum work reaching oversold levels, we expect the USD to be close to starting its next bounce attempt, where on the upside 97.37/97.66 remains a key breakout zone. As long as the DXY trades above its January bottom at 95.00, the conviction is bullish US$ biased, where a break of 97.66 would trigger a fresh cyclical long
signal and suggest a higher US$ into late April/early May. Pairs  SGD and AUD remain key directional indicators (H&S pattern forming) where into March we can generally expect a breakout set-up and trend impulse developing in the USD.
Renewal of strength in US$ would imply headwind for commodities, where last week we saw a first reversal in gold (after reaching the $1340 target) and with yesterday’s reversal in crude oil the CRB has likely completed a multi-month cycle top, which sets up a significant corrective pullback into early April before starting its next rebound leg into early May.

Asia/EM Risk

On the back of positive news flow on the Sino/US trade talks, we saw a massive rally in the SSE with a record volume spike in Chinese small-caps (CSI-500), similar to the 2015 bubble top. With the return of the retail money and the vertical rally, the current move is exhaustive. Short term, the SSE can still overshoot towards 3070 (next HSC target at 11900) but a tactical pullback in Asia and EM into later March/early April is the high conviction trade before starting its extension B wave bounce higher whereby Asia/EM is likely to post new reaction highs in its final wave B rebound cycle.

Crypto Risk:

The underlying bounce of the last month or so remains in tact with 5000 in line of sight although price momentum is fading here. Its make or break for this btc rally, in the next 2 or so trading sessions. Conviction is fading that the rally can sustain. Close stops but with a trading buy showing here and now.

I will try and update this report with some comments of the cftc report and a marco report from yardeni and a some charts on the above.

Kindest regards to all and have a great weekend.

Rich


Weekly Technical Analysis – “SP500 Peak, US$ Strengthening” 19th Feb19

Evening gents and apologies for missing last week’s report point.

All assets markets have a positive tail wind here with dovish comments from the several of the major central banks and what appears to be the last gasps of a renewal of the “bad news is good” theme of the last decade. Lead indicators like the 10/2 treasury spread are narrowing once again and equity tech indicators like breadth and momentum are flashing negative divergences within a 4 month cycle for indexes like the sp500.  Therefore the early February breakout in the SP500 continues to be a likely impulsive wave five extension/overshooting triggered by central bank dovishness instead of a new broad-based cyclical breakout campaign.

US risk:

Last week’s breakout of the SP500 has a new trading key support cash at 2739 (February 5th high). As long as this holds, there is further possible overshooting towards 2800. However, with heading into another minor top projection the conviction trade is for the SP500 to start a pullback this week with a re-break below 2739 to send the first confirmed trading setup short signal since the December lows. This would signal the breakout of the 200-day moving average would have been a classic bull-trap. 

From a cyclical US risk perspective, the December rally has been significantly extending, so that the tactical trading bottom will shift more into deeper March as the setup for starting its next bounce leg into early summer.
So tactically we were a little too early too cautious. Therefore this bullish (wave B) market bias is likely to extend into early summer19 making it increasingly likely to see the SPX re-testing its 2018 all-time high.

European Risk:

Europe is on the way into a 4-month cycle peak from which likely to retracing 38% to 50% of the December rally
into deep March. Nonetheless European risk is likely to form a higher trading bottom for more strength into
early summer. And on the back of expecting a weaker EUR its possible for a temporary surprise on the upside with
Europe a tactical outperformer of the US. Trading key support is at 3216 Eurostoxx50. Into March, a pull back towards 3118 to worst case 3078, is buying territory for another rally into early summer.

FX

US$ is taking its consolidating within an underlying bullish USD
context (support 95.00 in the DXY) and the Asian/EM dollar index testing its October downtrend. US$ strength. A break of the October downtrend in Asian/EM USD would imply that major breakout pattern set-ups in KRW, TWD and SGD are in motion, which will provide the backdrop for significant trend moves and higher cross asset volatility in Q2 and in H2.

EM Risk:

A major US$ breakout across the Asian/EM FX block would be a major tactical game changer for Asian markets, where there is increasing selectivity and fading relative momentum. The big outperformer in the region is currently China outperforming, but where in the Shanghai Composite we saw a massive volume spike, which suggests exhaustive buying climax, and is therefore a contrarian sell set-up.

Precious Metals

In gold, as long as the yellow metal trades above $1300 another bounce here and a new reaction high but which is likely to be the final wave overshooting before expecting a more significant pullback into Q2 to work off its medium-term overbought stance. On the upside $1360 remains a potential target zone, whereas a pullback into Q2 should not go below $1260 before starting its next rally/bounce into later H2.

Crypto BTC

Tactically BTC has had some positive price moves in the last week with short term momentum price indicators like the cci coming back to life in the instrument. Today we scored a move back above the instrument’s 50 day moving average and with positive confirmation from price momentum indicators in the 4hr chart. Although yet to be confirmed in the daily. 200 day moving average at 5000 US$ the conviction next tactical target area.  Individual stock wise GLXY (Galaxy Digital Holdings, Novogratz’s closely held listed enterprise) adding 20% on today’s move. (For disclosure I do have an interest in the stock).

More to come

All the best

Rich